Log AWS VPC Flows

As I transition to working in “the cloud” more I am embracing the new technologies and methodologies. However, I’m also trying to replicate what I do in on-prem environments when it makes sense. One way I like to collect and analyze data is using NetFlow. NetFlow provides network conversation details at a higher and summarized level. This has led to quicker recovery time on numerous occasions, or avoided issues entirely. It isn’t exactly the same, but I have figured out how to log AWS VPC flows to provide the data. Here’s a brief walk through of the setup.
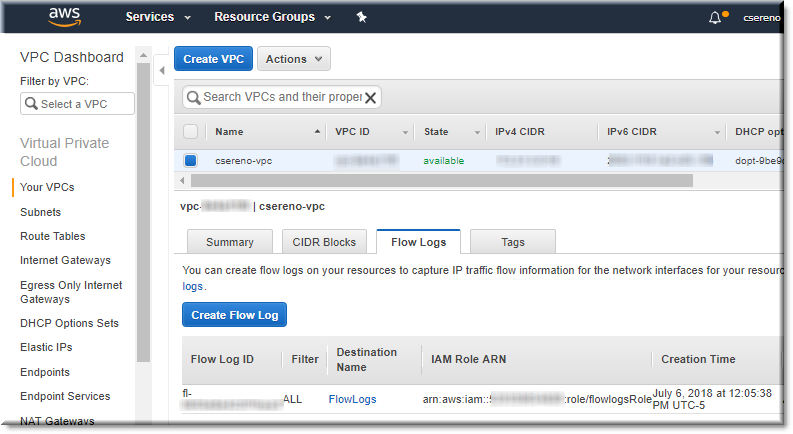
Create Flow Logs
The first step is to select the VPC and then the “Create Flow Log” menu item from the “Actions” drop down.
See them attached to VPC
After confirming its creation I saw the log ID listed in the “Flow Logs” tab.
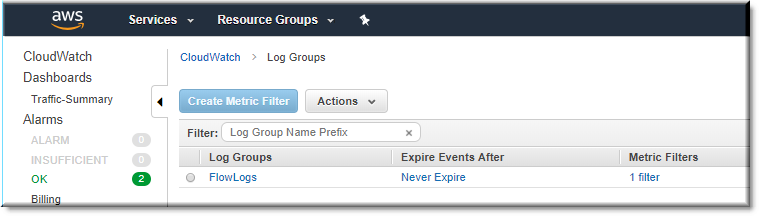
View Configured Flow Logs
Hopping over to the CloudWatch logs I could see my newly created log group.
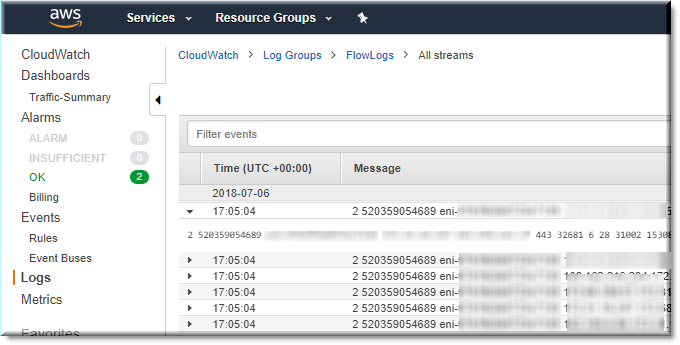
Log View
After selecting the log, I could see the session flows for my server!
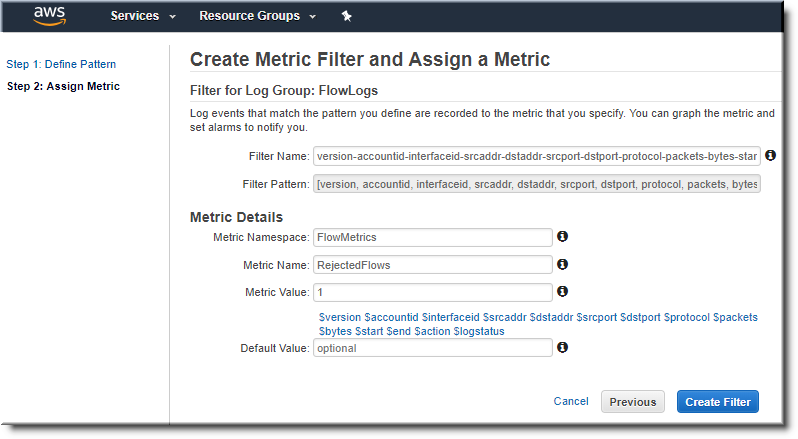
Assigning a metric
I decided to take it a step further and graph some of the output. Unfortunately, CloudWatch only allows you to graph actual metrics and not any of the data, but it’s a start. I used the following filter pattern:
[version, accountid, interfaceid, srcaddr, dstaddr, srcport, dstport, protocol, packets, bytes, start, end, action=REJECT, logstatus]
AWS lists more of the syntax here: https://docs.aws.amazon.com/AmazonCloudWatch/latest/logs/FilterAndPatternSyntax.html
I was impressed that it allowed for testing when defining the pattern. I could see my effects in real-time.
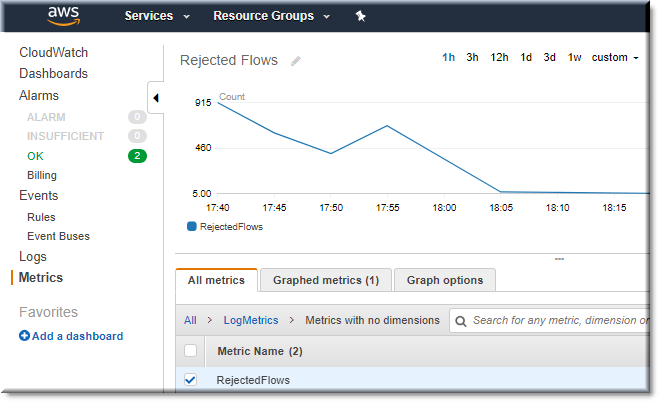
Graph the Metrics
This is my graph of the sum of rejected flows over the past hour.
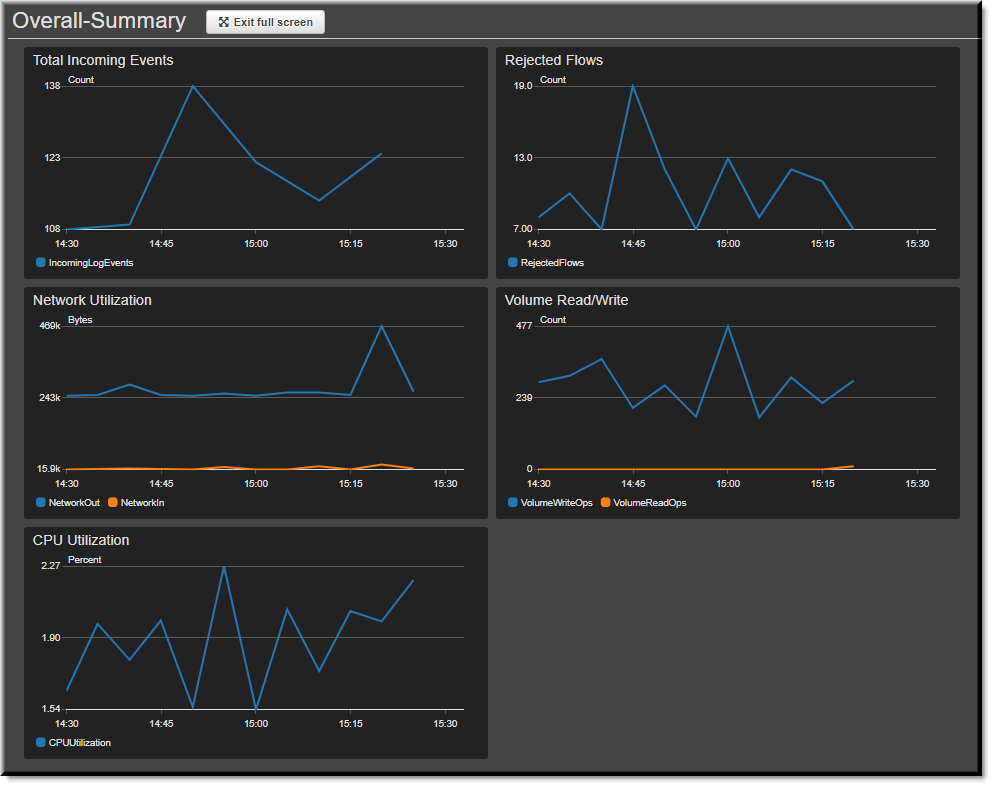
Create a Dashboard
Going even further, I created a dashboard with other built-in graphs. This is a screen shot of the full screen view in dark mode with auto-refresh for an even more interesting experience. This could be a good excuse to buy a 3rd monitor 🙂
My next step might be to create events and alarms as well just to see how far the built-in capabilities can go. Due to the limitations of CloudWatch, to see the actual values I have to look in the logs and then either copy/pasted out, or possibly send them to Lambda, Kinesis, SNS, S3, and/or even an Amazon database for use with AWS Athena. This could definitely keep me busy for awhile! If you’ve done this before or have experience in this area, please leave a comment below and let me know how I can improve what I’ve started.
Additional resources:
Related blog:
http://rodos.haywood.org/2015/06/vpc-flow-logs.html
**Centralized Logging Account and Retention:
Gigamon blog: