Case of the Tired Firewall

Have you ever had a nightmare where you are being chased and you can’t just seem to run away fast enough? No? Well, maybe you’ve tried running through snow up to your knees or swimming while wearing jeans. All of those examples point to situations that feel like something isn’t quite right. Cases where there could be better performance if only something was changed or improved. Sometimes this same thing happens to network devices. In this example, it’s the case of the tired firewall.
Problem
It was a typical day in the office with users milling about drinking coffee, others happily working, and some furiously pecking at their keyboards with deadlines looming. For a small segment of users, though, things weren’t normal. They were staring at their monitors with looks of puzzlement and confusion. Instead of working on their latest application update they were running tests with varying and unusual results. They found several symptoms, but were unable to pinpoint the root cause of their troubles.
Symptoms
Things in the production environment were running great. The test environment, though, felt slow with requests taking a long time or timing out randomly. A network admin might typically scoff at this with a retort that it clearly is an application issue in test and they must have changed something. However, nothing had changed and everything was working fine the day before. There was also some pretty clear evidence the problem was network related.
To the astonishment of the network admins, these power users had already collected some initial testing data. Once the network staff had finished cleaning up their shattered coffee mugs they dropped from their amazement, the real work began. First up was a review of the pings and traceroute data the team had collected.
Test Data
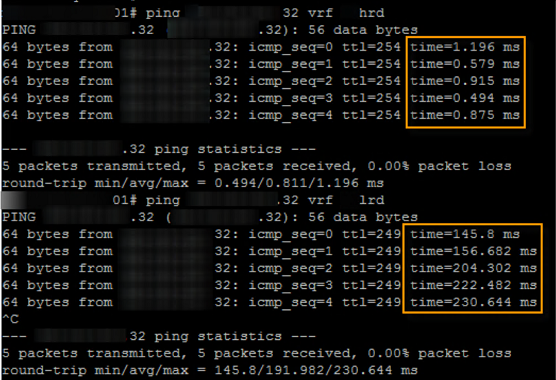
The ping tests showed [IP addresses redacted] a major difference when coming from the different source domains (HRD and LRD in this case). These devices sat in the same data center only a few hops away from each other. Something didn’t add up.
The traceroutes showed a similar story, but the screen shots evaded capture. They also revealed the hops at which this additional latency was occurring. As you might have already guessed, they were occurring at the LRD firewall. After some finger-pointing and rebuttal the firewall team consented to a quick look and some packet captures.
The event and performance logs on the firewall were clean. There were a few random CPU spikes, but they didn’t seem to correlate exactly with the intermittent problems faced by the users. Memory, disk space, and security issues all seemed to check out fine as well. There was nothing seemingly wrong with the firewall. Being in the middle of this traffic and at the heart of the latency problem, though, it was the perfect spot for a packet capture. The team fired off some more ping tests and the firewall team captured on both the incoming and outgoing interfaces. The results were clear, and “packets never lie.”
The left highlighted column shows the last portion of the timestamp on the incoming packets. The right highlighted column shows the last portion of the timestamp on the outgoing packets. This capture shows delays of ~30-70 ms as packets traverse the firewall for the ICMP requests (results were the same for the ICMP responses as well). Other tests showed higher and some smaller. A 70ms one-way delay adds up to 140 ms round-trip delay which lines up with the results of the users ping tests. The results were in, and the firewall team was in the proverbial hot seat.

Resolution
Without much more to go on, the firewall team continued to review the appliance, configuration, logs, and more. The only thing they found was that the firewall had not been rebooted in over 200 days. With nothing else to try, they decided to fail over to the redundant firewall and reboot. The power was cycled and everyone held their breath as they hunched over a single monitor watching the ping results. A few moments later, the team was smiling and clapping as service was restored and latency returned to normal. Or had it? Another moment later, there were 3-digit RTTs again! Looks of bewilderment now fell on the firewall team. About 10 minutes had passed while the team kept troubleshooting when all of a sudden the ping tests returned to expected levels! What caused this change now, and would it stick this time? Management directed to hold off on rebooting the redundant firewall still experiencing the problem and wait for a while to see if the test results stuck.
The general office banter resumed while the allotted time passed. Eventually, it was time to review the results and make a decision. The users claimed all was still working well and ping tests were good. Management gave their approval and the redundant firewall was rebooted. Interestingly, the same thing happened. Traffic returned to normal for a minute or two, then shot back up to high latency, then fell back to normal after 10 minutes.
The firewall logs never did show a problem. The team’s investigation never found root cause. It seems this was a case of a tired firewall that just needed a reboot. I’ve added this to the growing pile of unsolved mysteries with the hope that it never returns or that we learn the real problem, so we can address it properly. A scheduled reboot has been added to the patching process now as well to help avoid this problem in the future.
Remember to save often, check your cables, and REBOOT!