Performing a Capture

Start the Capture
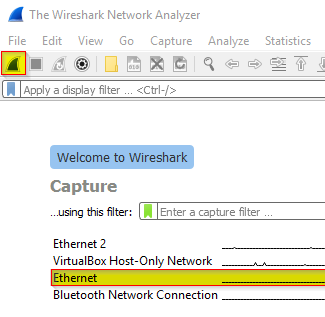 Now that you’ve decided where to capture, and you’ve prepared your interfaces and filters, you are ready to perform the capture. All you have to do at this point is hit the start button or double-click the interface in the list. There are usually multiple interfaces listed, so make sure you know which one you are wanting to use. Generally, this may be indicated by a small moving graph to the right of the device name indicating there is traffic present (the screen shot below currently show no traffic as I was in a lull). With Wireshark and some other utilities you also have the option to capture from multiple interfaces at once.
Once the process is started, Wireshark uses the WinPcap driver to collect the packets from your network card and then displays them on-screen (if you haven’t disabled that option for performance reasons). You will see columns and rows of numbers, letters, and words rapidly scrolling across the screen. This is as close to the look and feel of “The Matrix” as you’ll ever get. Once you learn how to read a packet capture, it is sometimes possible to even glean information while it’s scrolling. (While not the best party trick, you might impress a few people here or there!) At a basic level, each row represents a packet the network card is sending or receiving.
Generate Desired Traffic
While the packets are scrolling, be sure to generate the traffic you are wanting to analyze. So, either open the program you need, enter the command in question, visit the URL, or even have the end-user perform the action that causes the problem. A capture without the desired traffic is useless, so while this step seems like common sense, or potentially unrelated to the capture process itself, it is crucial. You will want to limit how much you capture though. I generally try to capture only one specific step or problem. You can do more if the actions cause distinct patterns in the traffic. You may also use “markers” such as ping packets to help divide a capture.
Stop And Save
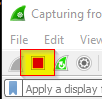 Once the task in question has been performed and comes to end, you may stop Wireshark. This is simply a click on the red square in the task bar. The packets will stop scrolling and you can then begin your analysis. It’s also a good idea to save the capture. Wireshark has a nasty habit of crashing in the middle of your analysis just when you need it most! Saving will keep you from losing all of your work up to this point. Saving also allows you to open the file in other analysis software, send it to a colleague, friend, or vendor, sanitize the information, and/or upload it to a repository such as CloudShark. You may save the entire capture or even carve out only what you need.
Congratulations! You have just completed your first packet capture. Don’t worry about understanding what is on your screen at the moment. While it seems daunting and can actually be very complex as it dives into the bowels of network and application protocols, some threads are relatively simple to follow and understand. I’m going to follow this set of posts with a set introducing Wireshark itself and a basic analysis example. Capturing traffic is one thing, and so is learning the various tools of the trade, but actual traffic analysis is yet another learning opportunity.
*Note: I will be creating and attaching a quick reference guide on these steps soon. Also, check back for the introduction to Wireshark!