*Disclaimer: all captures in this post were anonymized using TraceWrangler.
I was recently asked to help with a performance issue. I was informed a transfer was going to take weeks instead of a couple days as expected. The transfer rate was getting 80Mbps throughput max on a 10Gbps connection. So, I setup captures at both ends and got to work. This is just a quick summary of that work with the classic tell-tale signs of a performance problem.
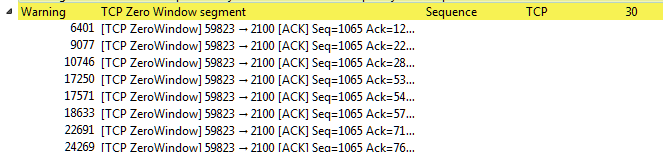
The first thing I noticed were 30 zero window segments in a matter of seconds in the “Expert Information” window. One or two might be tolerable under normal circumstances, but 30 is something of interest. Small TCP window sizes and zero window packets generally mean there is a problem with one of the end devices.
This grabbed my attention, so I moved back to the packet list. When looking at the Zero Window packets I noticed delays anywhere from 100 to 300 ms before the Window Update. (If you don’t have a TCP Delta/Delay column setup already in your instance, I highly recommend it!)
TCP Zero Window follow by a delay
This was also clearly evident in the Time Sequence Delay graph. This is a classic example of the “stair step” graph. This should look more like a diagonal line up to the right. The receiving end cannot keep up with the data flow and is slowing the traffic.
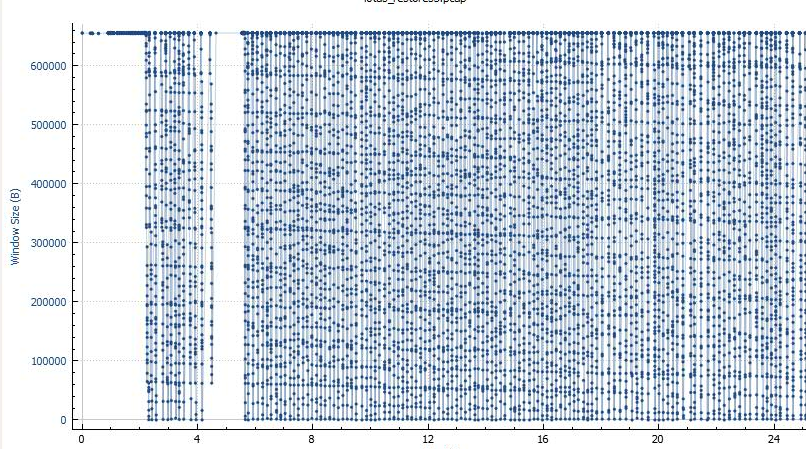
Reviewing the Window Size graph revealed an even more disturbing picture. It seems the server couldn’t keep up at all with the incoming data. The window sizes dropped rapidly, and they all delayed before the acknowledgement and window update.
I decided to glance at the TCP options in the packets of the TCP handshake. The calculated window sizes and maximum segment size looked good. The Window scaling leaved something to be desired. Packet TCP Options
These were all classic symptoms of a performance issue on the receiving server. In this case, the server admin performed a few network tweaks and adjusted settings in the security software resulting in the disappearance of the reducing window sizes/zero window packets (the visible network symptom of root cause). Consequently, the delays were shortened and performance increased. Unfortunately, the day took a quick turn and I was unable to capture the new data to get a “before and after” snapshot or ask what “tweaks” he made specifically, but the results speak for themselves. Another performance issue resolved, another happy customer, and a cookie cutter example of performance indicators in Wireshark.